Climate Impacts
 More frequent floods
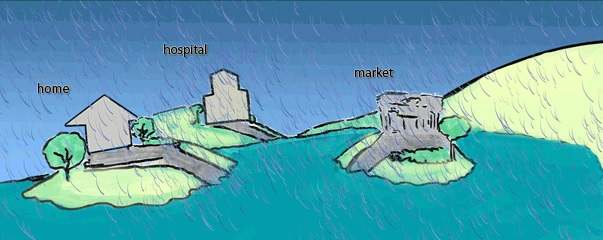
Extreme high Bay water levels will occur more often, leading to more frequent flooding in flood-prone areas that could cause disruptions of emergency services and access to power, water, food, and medical care.
 More extensive, longer-duration
flooding
Higher Bay water levels especially during storm events will flood larger areas for longer periods of time. Along with many other potential impacts this may result in the increased mobilization of pollutants if contaminated lands such as closed landfills are subjected to prolonged inundation.
 Permanent inundation
Sea level rise will cause areas not currently exposed to the tide to be inundated, resulting in the need to either protect or move people and infrastructure, and the loss of trails, beaches, vistas, and other shoreline recreation areas.
 Shoreline erosion and overtopping
Higher Bay water levels will cause changes in tidal and wave energy, leading to increased shoreline erosion and the potential that levees and other types of shoreline protection will be overtopped.
 Elevated groundwater and increased salinity intrusion
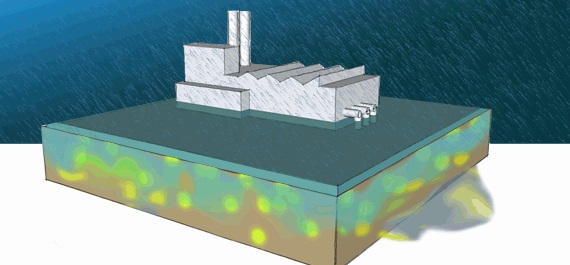
As the Bay rises, groundwater levels and salinity intrusion will increase, affecting water supplies along the shoreline, damaging below- or at-grade infrastructure, requiring additional pumping and costly maintenance and repairs of stormwater and flood control facilities, and increasing the risk of earthquake induced liquefaction.
To learn more about these impacts, download the Climate Impacts Statements (![]() ) from the ART Alameda County Project, and click on the “Climate Impacts Gallery” below to see animations of each of the five climate impacts.
) from the ART Alameda County Project, and click on the “Climate Impacts Gallery” below to see animations of each of the five climate impacts.

Climate Scenarios
Sea level rise is often visualized using maps that represent specific scenarios (e.g., 12 inches) or extreme water levels (e.g., the 100-year storm), or time horizons (e.g., 2050), however because there is uncertainty in sea level rise projections, selecting the most appropriate scenarios to support project planning and analysis is not always simple and often requires to planners looking at large number of maps all depicting futures scenarios that could be relevant, including possible sea level rise amounts that could occur during their planning horizon as well as maps of additional elevated water levels that occur during extreme events. One Map, Many Futures solves this problem by relying on equivalent water level approach. Each ART map reflects a variety of possible sea level rise and extreme tide level combinations (i.e., 0 to 66 inches of sea level rise coupled with extreme tides from 1 to 100 years), and can be used to approximate impacts from either permanent inundation from daily high tides or temporary flooding from sea level rise and extreme tides that may occur at any time.
Daily High Tides vs. Extreme Tide Levels
The daily high tide (MHHW) was selected to inform which shoreline areas not currently exposed to tidal action could be exposed to the high tide with sea level rise. This Bay water level is important because exposure to the daily high tide would result in frequent or permanent inundation, potentially leading to the slow yet chronic degradation of asset physical condition or function.
In contrast, assets exposed to a 100-year extreme tide level would be subjected to infrequent and temporary, but potentially severe, flooding. Extreme storms can cause overtopping and erosion of shoreline protection assets, exposing large inland areas to fairly deep flood depths and high velocity flows. Wind waves can elevate water levels significantly above stillwater levels, potentially increasing the severity of flooding. It is critical, therefore, to consider the effect wind driven waves could have on inland inundation during a coastal storm event.
Links:

For more information:
- Jaclyn Mandoske
- Jaclyn.Mandoske@bcdc.ca.gov
- 415-352-3631