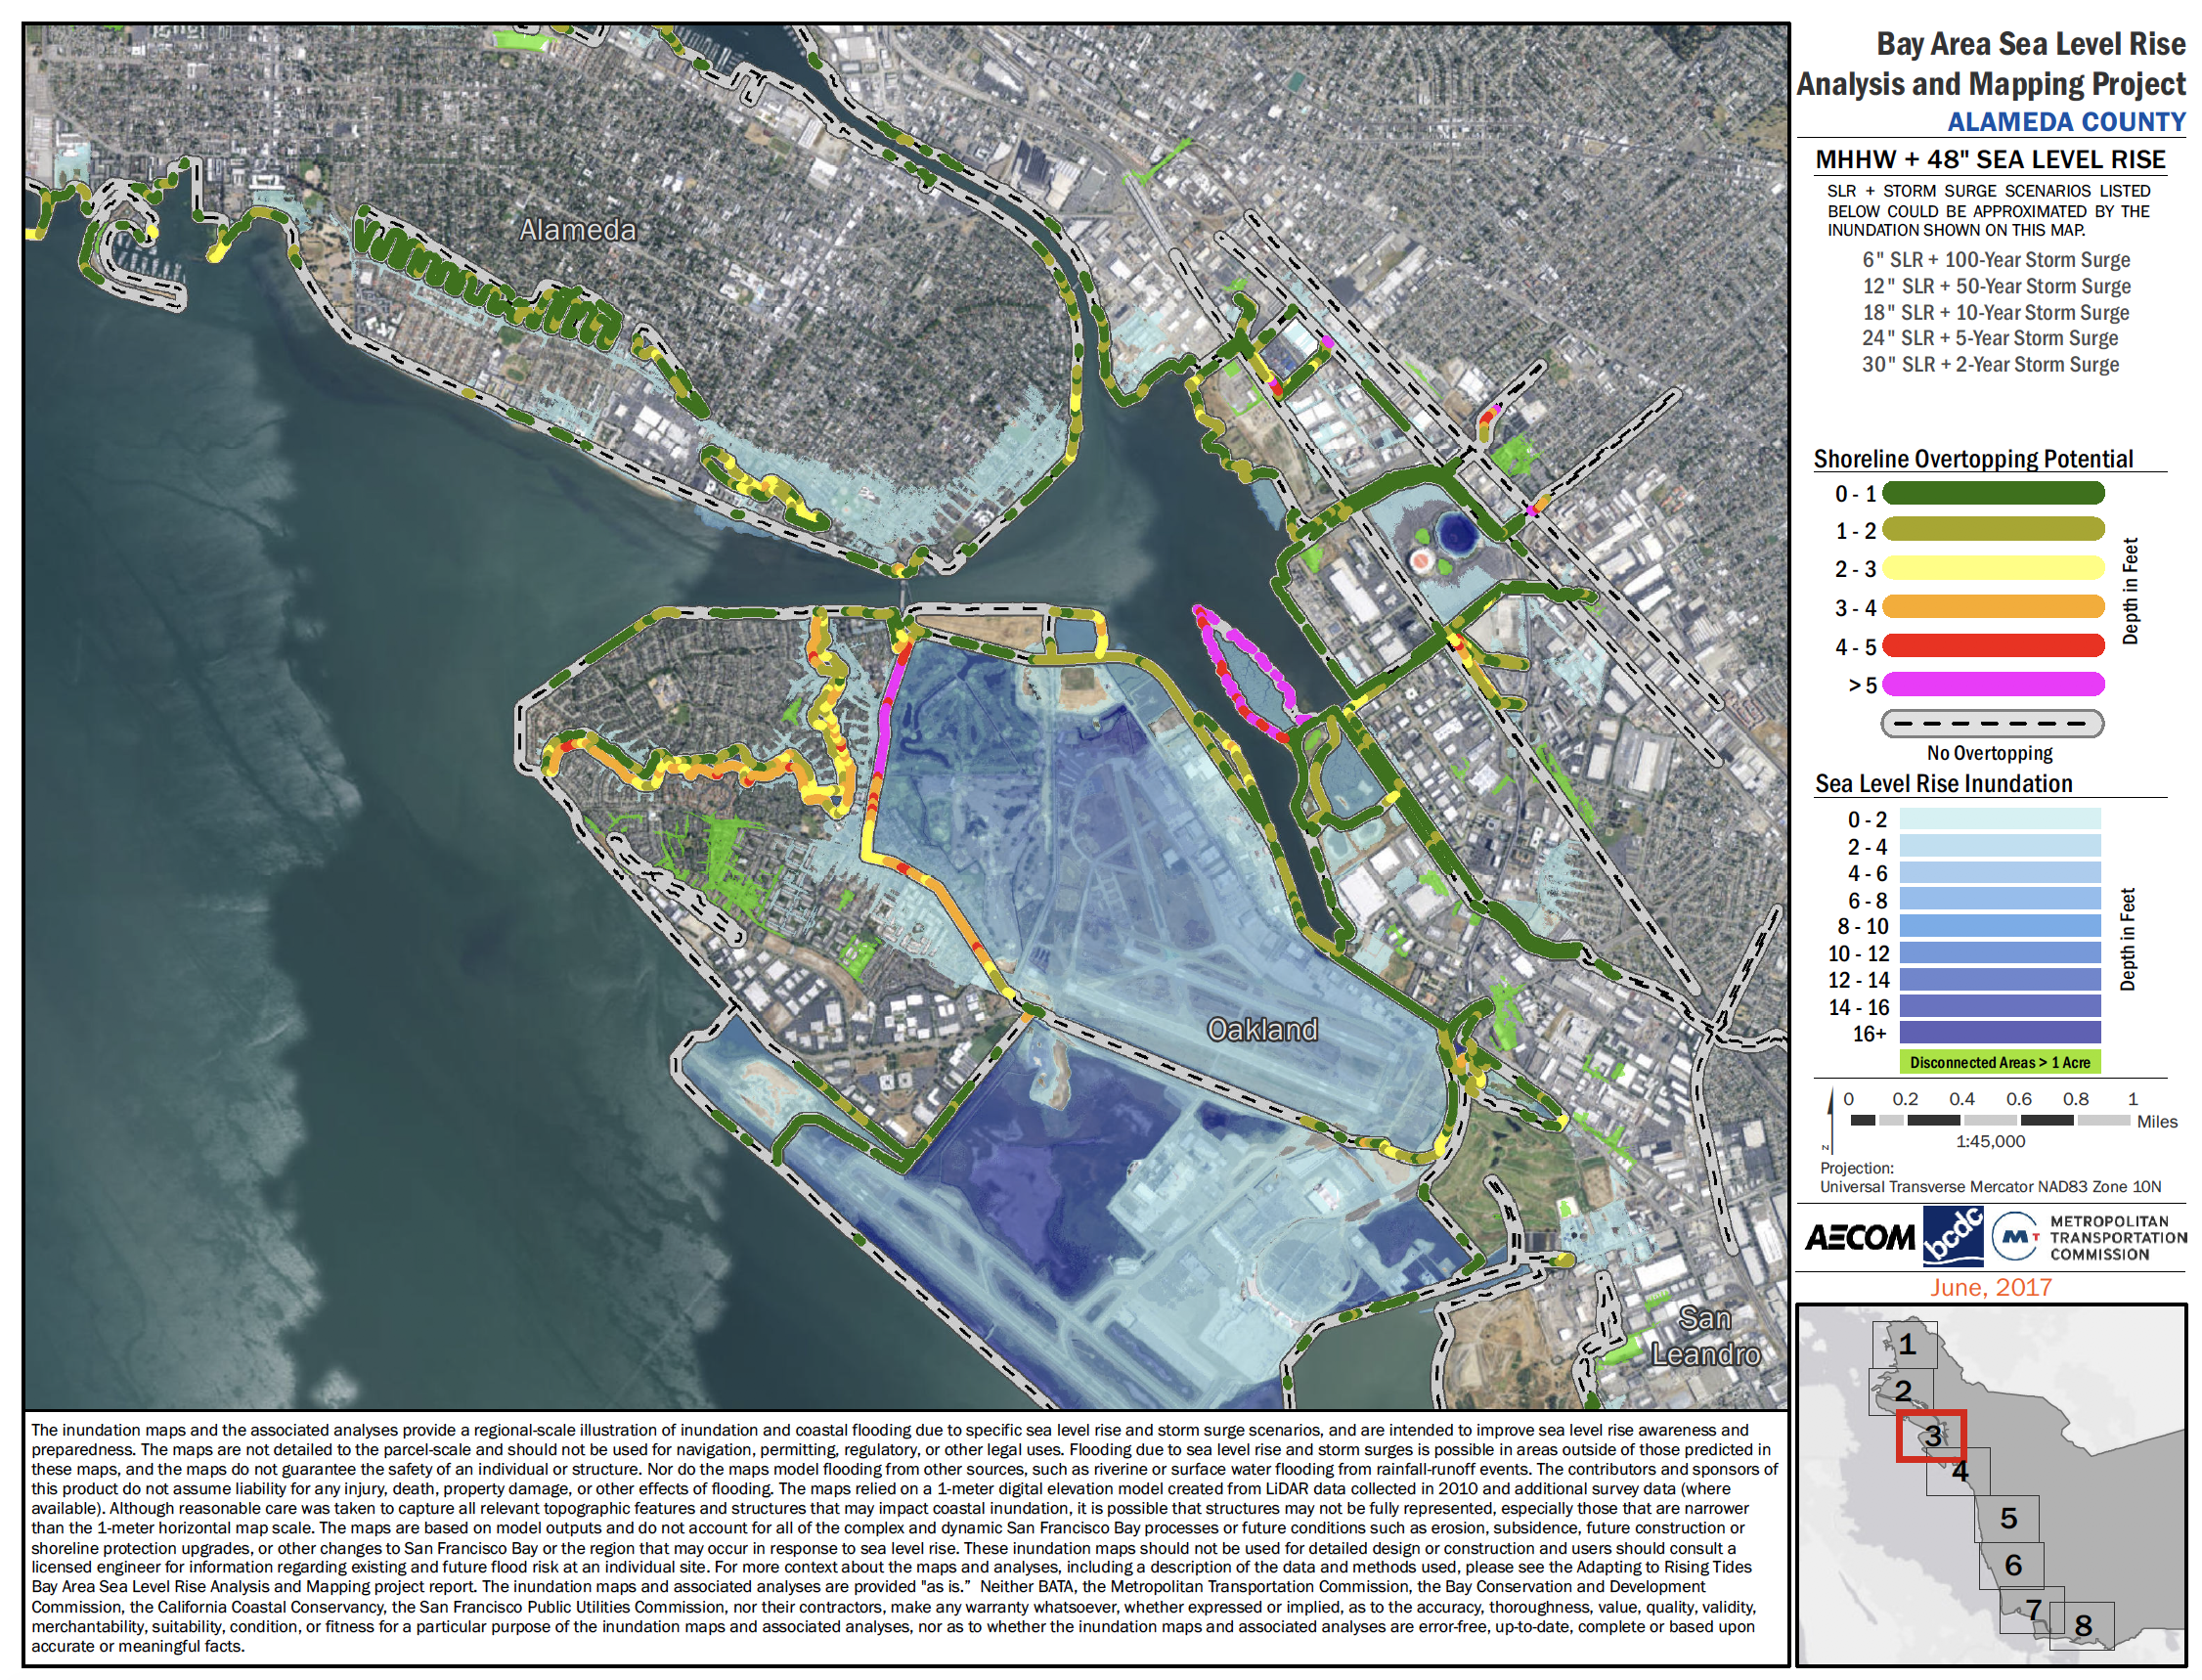
Example sea level rise inundation map. Credit: ART Maps 2017
An exposure analysis identifies which assets will be exposed to a specific climate impact or hazard. It provides insight into the amount of possible damage or loss that could occur, for example to different types of land uses such as housing or commercial properties, and to the community members who rely on these uses.
While an exposure analysis is a necessary part of an adaptation planning assessment, it does not capture the nuances of how a climate impact or hazard may or may not affect the assets being evaluated.
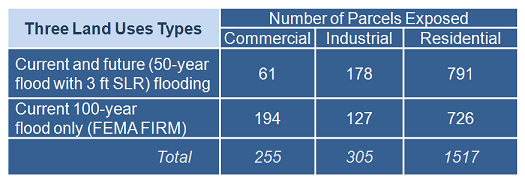
Example exposure table. Photo credit: BCDC
For example, if homes have been elevated, they may be less at risk than they appear on an exposure map. However, even homes that are not directly exposed to flooding may be vulnerable if the key access roads or services (e.g., power, emergency response) that they rely on are affected. An exposure analysis is only one component of a robust assessment and needs to be completed in parallel with gathering information about asset existing conditions, and the causes and components of vulnerability and consequences. The ART Program has developed a set of assessment questions to systematically and efficiently gather this information for a wide variety of assets.
Exposure Analysis in ART
Evaluation of exposure to climate impacts is based on the selected scenarios. Experts with local knowledge of the project area, the shoreline, flood control and stormwater assets ground truth the exposure analysis findings which are summarized into maps, tables, charts and statements.
The ART approach to analyzing exposure is a stepwise process that begins with reviewing available data and information for each climate impact or hazard being addressed. For some impacts or hazards, such as flooding from current storms or future sea level rise, ready-to-use mapping tools may be available. For other impacts that are not as well-studied or understood (e.g., salinity intrusion due to sea level rise or precipitation patterns) reliable information may not be readily available.
Readily available data and information is then used to evaluate exposure. For sea level rise the exposure analysis can answer the following questions:
- Will the asset in question get wet?
- If so, during what storm event, or with what amount of sea level rise?
- And, to what extent or depth with the flooding occur?
Once the exposure analysis is completed the summarized findings need to be reviewed by those with local knowledge and experience. This will help pinpoint the locations where regional or broader mapping has not adequately characterized local conditions and where additional studies, field verification, remapping or re-analysis is needed.
Total Water Level Analysis
To evaluate coastal flooding, the ART Program uses a total water level approach in which each water level represents a range of possible future scenarios.
This approach reduces the total number of maps needed because each map represents a different, unique combination of sea level rise and storm events (extreme tides due to storm surge) that can result in current or future flooding. Extreme tides are the maximum high tide level that has occurred over a specific return period (recurrence interval) that correlates to a specific occurrence probability. For example a 100-year extreme tide has a return period of 100 years, and therefore a 1% chance of occurring in any given year.
Shoreline Overtopping Potential
Overtopping potential refers to the condition where a specific water level exceeds the elevation of the existing shoreline, potentially causing flooding of inland, low-lying areas.
The ART Program has analyzed the overtopping potential in a number of different projects to identify where the shoreline might not be high enough to control inland flooding that could occur from a storm event or due to sea level rise. These analyses do not account for the physics of wave setup and runup, the condition of the shoreline asset, or the potential for the asset to fail due to scour, undermining or a breach after the initial overtopping occurs. As such, the overtopping potential served as a screening tool to help direct resources to specific shoreline areas where further study is needed to understand the risks.
Links:
- Overview Presentation: ART Exposure Analysis

- How-to > Design Your Own Project >
- 2. Choose an Approach
- 3. Do the Assessment
- How-to Guide: Exposure Analysis
- Technical memos, reports and case studies from ART projects:
- Climate Impacts, Scenarios and Total Water Levels Memo
- Tidal Datums Technical Study (25MB)
- Technical Report: Alameda County Shoreline Assessment (50MB)
- Project Report: Hayward Shoreline Resilience Study
- Case Study: Hayward Shoreline
- Case Study: Bay Farm Island
- Case Study: Coliseum
- Case Study: Bay Bridge Touchdown

For more information:
- Nick Sander
- Nicolas.Sander@bcdc.ca.gov
- 415-352-3636